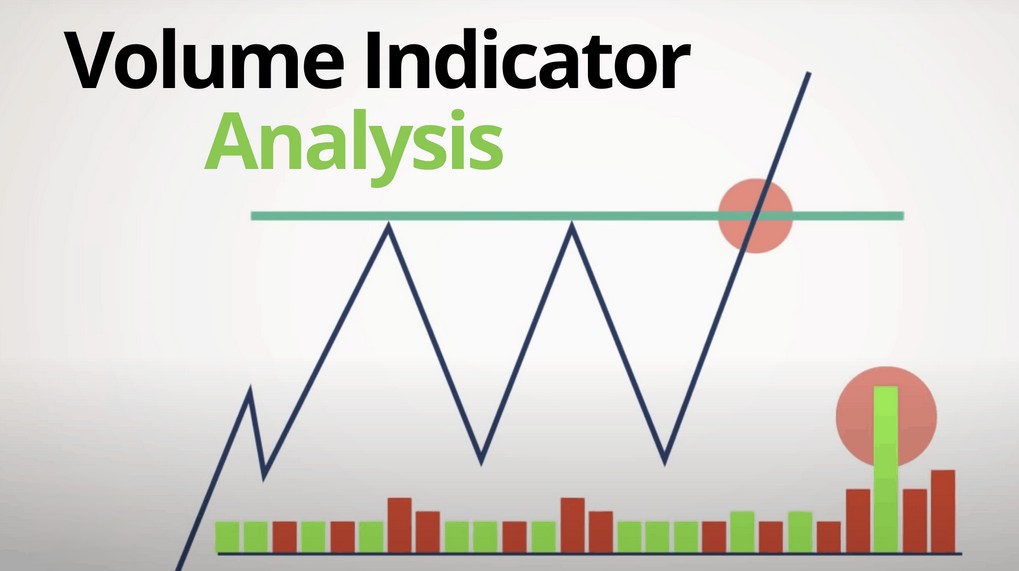
Volume indicators are technical analysis tools used by traders and analysts to assess the trading activity and volume of a financial asset, such as stocks, commodities, or currencies. These indicators provide insights into the strength and sustainability of price movements. They are often used in conjunction with other technical analysis tools to make more informed trading decisions.
some common volume indicators –
The most straightforward volume indicator is the raw trading volume, which simply represents the number of shares, contracts, or units of a security traded during a specific period, usually a day. An increase in volume can indicate a stronger, more sustainable price move.
On-Balance Volume is an indicator that seeks to measure buying and selling pressure. It assigns a positive value to the daily volume on up days and a negative value on down days. The cumulative total of these values forms the OBV line. When the OBV line is rising, it suggests that buying pressure is increasing, potentially indicating an uptrend.
This indicator is similar to OBV and measures the accumulation of a security by adding a volume-weighted indicator based on price action. It aims to identify the accumulation (buying) or distribution (selling) of a security over time.
MFI combines price and volume data to measure the flow of money into and out of a security. It is a momentum oscillator that can help identify overbought or oversold conditions.
CMF is a volume indicator that uses both price and volume to assess the flow of money in and out of a security. It is designed to identify accumulation or distribution phases.
VPT is an indicator that attempts to quantify the relationship between price and volume. It can provide insights into the sustainability of a price trend by focusing on the percentage change in price multiplied by volume.
This indicator compares the current trading volume to the average volume over a specified period. It can help traders identify unusual trading activity that may be indicative of a significant event or price move.
Some oscillators, like the Volume Rate of Change (VROC) or the Volume Oscillator, are used to track the rate of change in volume. They can help identify turning points or divergences in price and volume trends.


