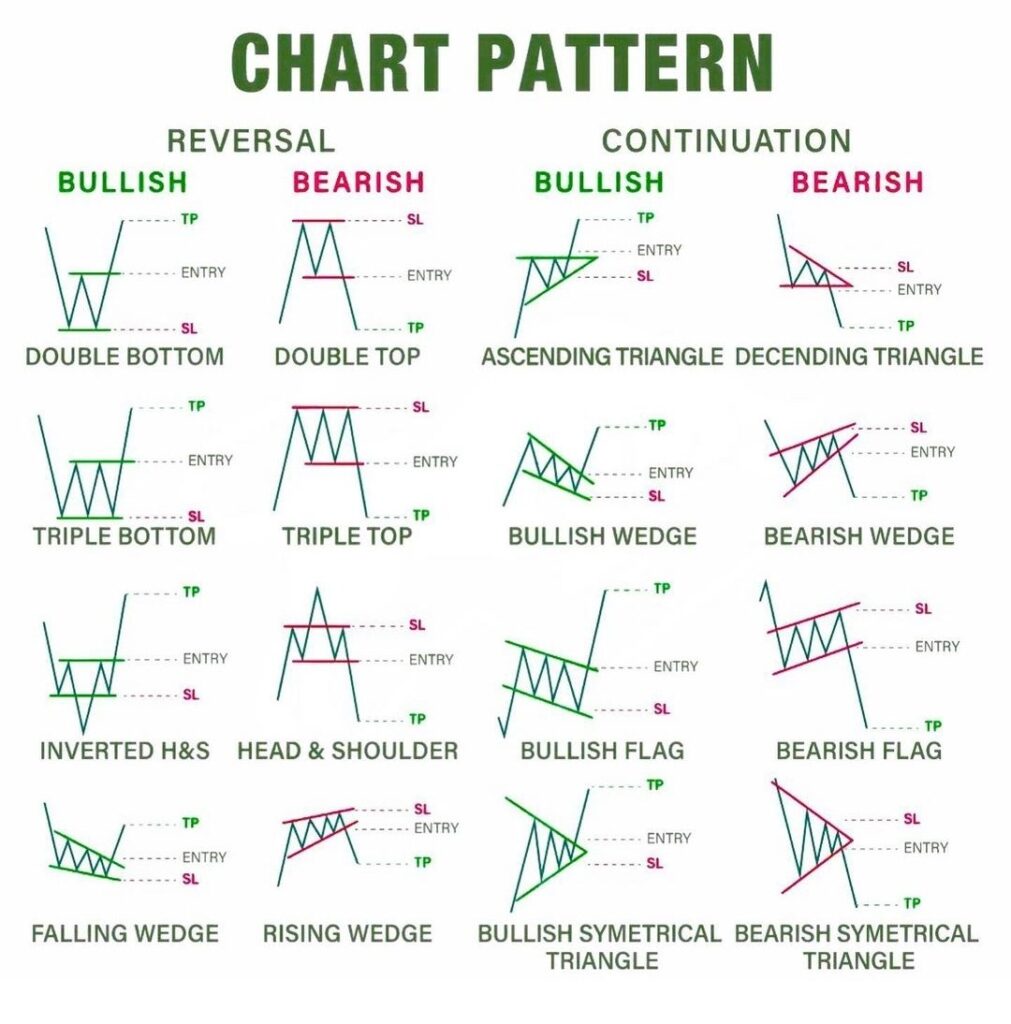
Chart patterns and technical indicators are two distinct categories of tools used in technical analysis to analyze financial markets and make trading decisions. They serve different purposes and offer unique insights into price movements.
Chart Patterns –
Visual Patterns: Chart patterns are graphical formations that appear on price charts. They are recognized by patterns formed by the price movement over time.
Behavioral Analysis: Chart patterns are based on the idea that market participants exhibit recurring behavioral patterns, which can be observed and used for predictive purposes.
Examples: Common chart patterns include head and shoulders, double tops and bottoms, triangles (ascending, descending, and symmetrical), flags, and pennants.
Timing: Chart patterns are typically used to identify potential trend reversals or trend continuation. Traders look for specific breakout or breakdown points within these patterns.
Subjectivity: Interpretation of chart patterns can be somewhat subjective, as different traders may see patterns differently. There may be variations in pattern recognition.
Technical Indicators –
Mathematical Formulas: Technical indicators are mathematical calculations or algorithms applied to price and/or volume data. They provide quantifiable data points or lines on charts.
Price and Volume Derivatives: Technical indicators are often derived from price or volume data, and they provide quantifiable information about market conditions, momentum, and trends.
Examples: Technical indicators include moving averages, Relative Strength Index (RSI), Moving Average Convergence Divergence (MACD), Stochastic Oscillator, Bollinger Bands, and more.
Timing: Technical indicators are used for various purposes, such as trend following, momentum analysis, overbought/oversold conditions, and volume analysis. Traders use them for both entry and exit signals.
Objective: Technical indicators produce specific numerical values or lines on a chart, making them less subjective than chart patterns. Traders can define clear criteria for trade signals based on indicator values.


